|
GEMPLOT : |
GEMPLOT allows the user to represent graphically complex chemical
equilibrium calculated with GEMINI1 and GEMINI2. It's a
complementary tool which provides results analysis and their graphic representation.
From
outputs obtained from automatic iteration in temperature or composition with a GEMINI
code, GEMPLOT can read this datafile and extract the information.
The
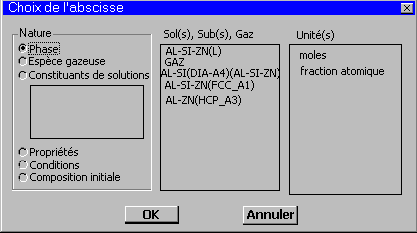
user can choose the representation he wants (abscissa, ordinate), through dialogue
boxes.
Then
capability will be offered to visualize this graph on the screen or to export
the selected values to another code (Excel, Sigmaplot, works...).
|
Example of abscissa choice, for
graphic visualization of a complex |
|
|
On the graph are some
capabilities:
- transformations on axes (log X, exp X, 1/X...),
- enlargement of some portions with the zoom,
- representation of the data by smoothing,
- modification of legends and colors of the curves.
![]() Webmaster(thermodata@grenet.fr)
Webmaster(thermodata@grenet.fr)
updating : 01/02/04
